홈

Infographic 템플릿
온라인 고객을 전환하고, 회의실에 깊은 인상을 남기거나, Shutterstock의 전문적으로 제작된 인포그래픽 템플릿으로 강의실을 놀라게 합니다.
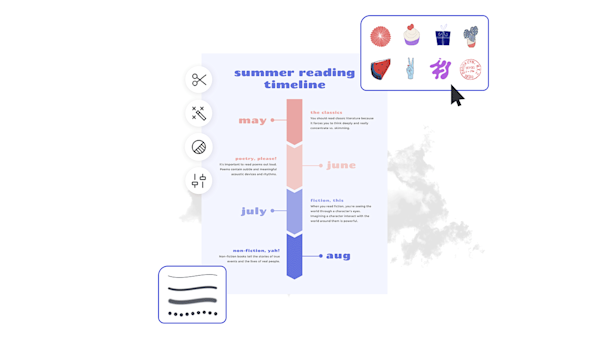
How to make an infographic
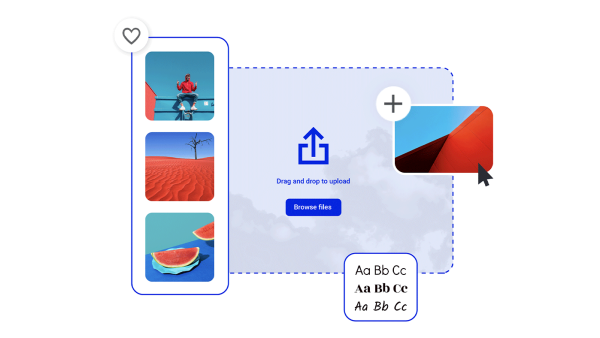
Infographics that make learning fun & fresh
Beautiful visual assets and creative intelligence
눈길을 끄는 인포그래픽을 만들기 위한 팁 및 요령

The Building Blocks of Infographic Design
We’ve reached a point where our attention spans are shorter than goldfish. So, if you’re creating an infographic, it should be as engaging as possible, from the ground-up.

10 Infographic Examples for Students
Explore 10 infographic examples for students, then learn how to make your own infographic in minutes with these tips and tools.

모든 디자인을 위한 Infographics 유형 15
인포그래픽은 읽기가 50% 더 쉽기 때문에 재미없는 세부 사항에 생명을 불어넣습니다. 시간을 절약하고 생산성을 높인다. 그 결과는 당신을 놀라게 할 것이다. 이 블로그 게시물에서는 15가지 유형의 인포그래픽을 탐색하여 콘텐츠에 대한 바를 높이겠습니다.

5 Reasons Why Infographics Still Matter in Content Marketing
Infographics remain a valuable form of content. Learn what makes them effective and uncover how to create memorable infographics sure to drive engagement.
Frequently asked questions about infographics
Just as it sounds, an attention-grabbing and effective infographic balances, well, info + graphics. Go for the Goldilocks vibe — not too much, not too little, but something just right to capture your audience. Decide if you want subtle, sophisticated, or a bit more bold and playful. A text effect, texture, or intentional color scheme can elevate information. Graphics can be fun or serious depending on your audience. So long as you have a balance of concrete, data-driven insights with creative and unique assets from Shutterstock Create, you can't go wrong.
There are a countless different infographic styles that can help you organize your components. Decide if you're highlighting statistics, a timeline, comparison charts, ordered steps, or a tips list. Once you have a general concept in mind, you can create from there. For example, statistic-driven infographics can be separated by a collage of colored boxes to distinguish one from the next. To diversify the content, create specific boxes for colored graphics so it's easy for the eyes to digest the visual. If you have a comparison chart, use a colorful header, footer, and background with diverse fonts and colored graphics to zhuzh things up while creating cohesion. You got this!
You can essentially turn any type of data-driven info into an infographic! Wanna highlight local real estate trends? Go for it. Summarizing the evolution of the stock market? Cool! Comparing airlines? Awesome. Whatever you're focused on, infographics elevate the delivery of basic information.


